
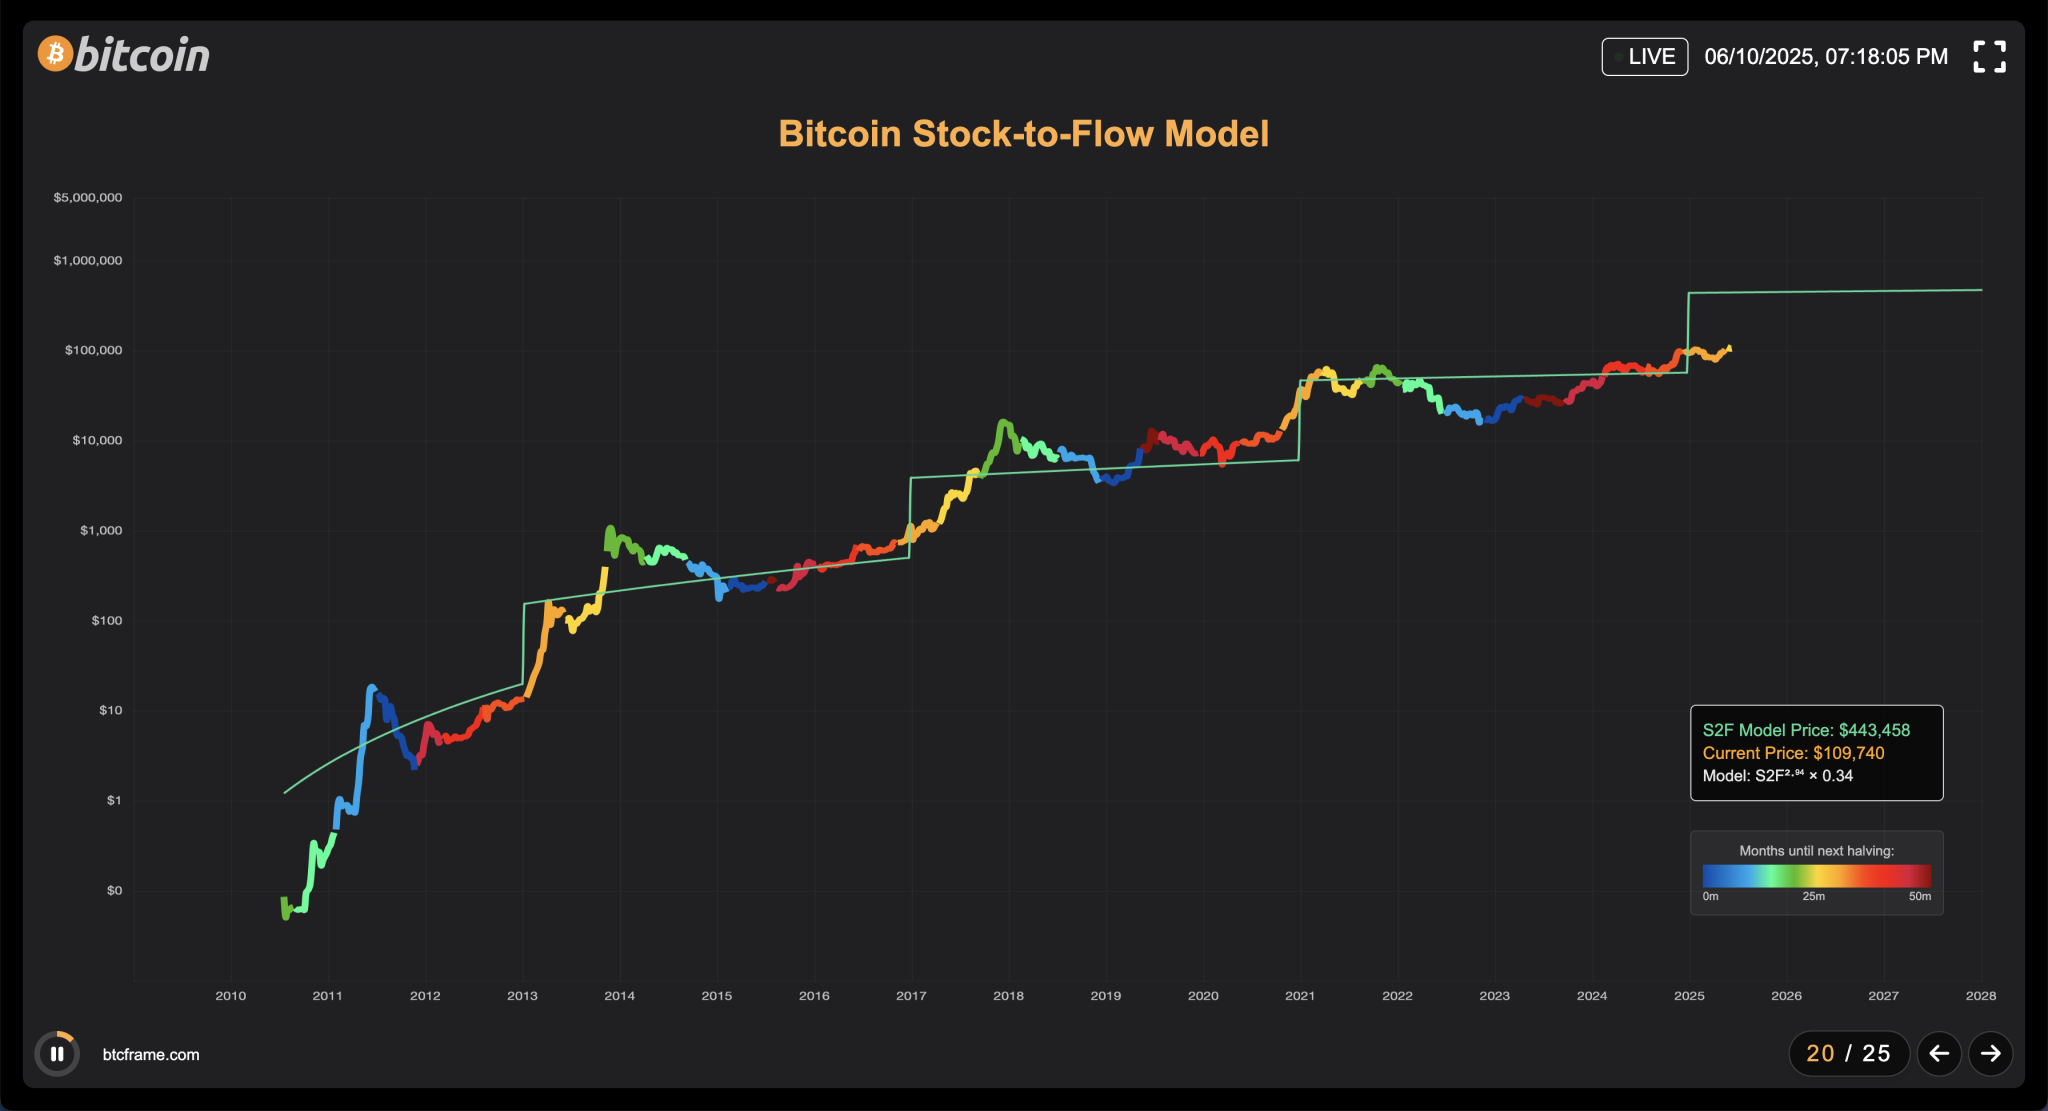
For years, Bitcoin analysis was dominated by a single question: what’s the price target? And for a while, models like Stock-to-Flow gave people a simple answer.
But Bitcoin is no longer in its adolescence. It’s now a trillion-dollar asset with growing institutional exposure, layered use cases, and rapidly shifting network dynamics. The tools we use to understand its valuation need to evolve as well.
It’s no longer about chasing a magic number. It’s about understanding the data — and what it actually says about behavior, pressure, and opportunity.
The Rise and Stall of Stock-to-Flow
Stock-to-Flow (S2F) came to prominence because it offered something rare in Bitcoin: a clean, elegant narrative. Scarcity drives value. Bitcoin has a fixed supply. Therefore, the fewer coins remain to be mined, the higher the price should go.
It was easy to understand. And for a while, the price followed it. Until it didn’t.
By 2022, S2F had broken down. Critics pointed out that it ignored demand, miner behavior, regulatory shifts, and macro shocks. It had no input for volume, velocity, or off-chain flows. It was a scarcity model trying to explain a complex marketplace. Useful as a lens, but not a compass.
The lesson? One model is never enough.
Enter the Real Models
Today’s best Bitcoin analysts don’t use a single chart — they monitor multiple valuation frameworks at once. Realized Price, for example, looks at the average cost basis of all coins currently in circulation. It shows the aggregate price at which the market last “paid” for its bitcoin, and often marks a psychological floor during bear markets.
Dormancy Flow examines the age of spent coins — showing when long-term holders are moving their stash. Puell Multiple tracks miner revenue and can expose when miners are overextended or capitulating. And Network Value to Transactions (NVT) compares market cap to transaction volume — a kind of Bitcoin P/E ratio.
Individually, none of these models is perfect. But together, they provide a much sharper view of Bitcoin’s heartbeat.
Real-Time, or Worthless
What these models have in common is that they lose power when delayed. A realized cap metric that updates weekly is borderline useless in fast-moving markets. Dormancy metrics pulled from archived datasets miss critical moves from long-dormant whales. Even miner-related models like the Puell Multiple can shift dramatically in a single epoch.
That’s why BTC Frame doesn’t just show these models — it streams them.
The dashboards on BTC Frame pull from live sources, allowing you to watch these models update with each block, transaction, or mempool shift. You’re not looking at snapshots. You’re watching the models breathe.
And that’s where real insight comes from — not just seeing the chart, but understanding when and why it’s changing.
Use the Models, Don’t Worship Them
Too many people treat valuation models like prophecy. That’s the wrong approach. Models are tools. They give you context, not conclusions.
BTC Frame doesn’t tell you what to believe. It shows you the raw data — beautifully visualized, cleanly organized, and ready for interpretation. Whether you’re watching miner revenue compression, or spotting the divergence between price and long-term holder cost basis, the goal is awareness — not certainty.
Because in Bitcoin, nothing is guaranteed. But clarity gives you an edge.
Final Thought
Valuation in Bitcoin isn’t static. It’s a moving target — shaped by flows, time, behavior, and incentives. The more models you understand, the sharper your instincts become. And the clearer your dashboard, the faster you can react when it matters.
BTC Frame puts those models in front of you — not to tell you what will happen, but to show you what’s actually happening.
Because good models don’t predict the future.
They help you survive it.